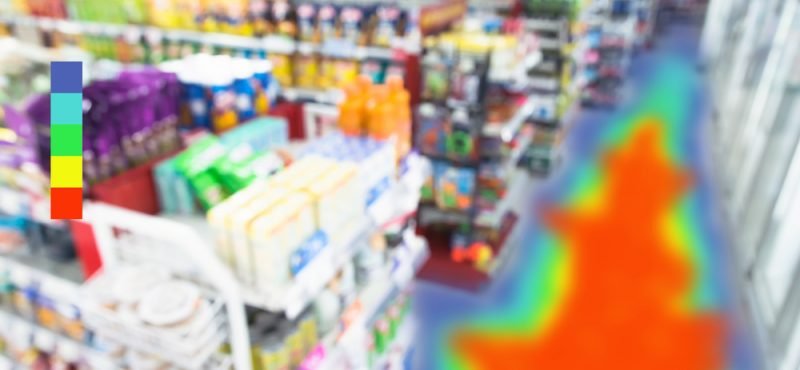
A store heatmap is a visualization method of customer foot traffic and flow patterns across the store. It is a coloured layer that can be added over the store layout that encodes human traffic information with color and its intensity. Colder regions, represented by blue through green colors are the spots which customers visit the least. Warmer colors indicate greater customer interest – the warmer the color is, the more the given region is popular. Information presented by means of colors is clear and easy to analyze. By extracting the warmest regions (orange and red) one can easily determine the typical ways the customer takes in the store and discover the most common journey patterns as well as the sales hotspots. On the other hand, the coldest areas indicate the store regions that are intentionally or unintentionally avoided by the customers. With these insights, a store manager can leverage the information to take actions on arrangement of shelves, products or staff.
What is needed to generate a heat map?
Heatmaps are easily created as one of the basic outcomes of smart computer vision techniques. These methods can be applied to images or video footage collected by the store monitoring cameras, provided they have proper coverage of store regions to be analyzed. In store heatmaps, the fundamental algorithm is people detection model, trained to recognize individual persons on the camera views. Such a model analyzes an input image (or video frame) and marks all detected people with rectangles (called bounding boxes). A single frame therefore brings only information on people’s positions in the store at a given moment of time. The heatmap combines the information from detections in multiple frames taken over a period of time. The analyzed time interval might be as short as a part of the day, a single day, a week or even longer, depending on the goal of the analysis. Starting with a blank map, by processing a sequence of sample frames with people detection, the heatmap algorithm records each occurance of detected person and increases the color warmth for the central pixel(s) respective to this person in the color map. When all processing is done, one gets a frame encoded with colors depending directly on the number of recorded detections.

There are numerous possible ways of leveraging information provided by heatmaps. The basic applications include planning of marketing activities and promotions as well as improving the customer experience. By analyzing the heatmaps and determining the best converting site exposures, the manager can easily arrange products on shelves to attract more customers and streamline operations. Apart from smart inventory management, heatmaps may be used to improve the store design, lighting, positioning of shelves, etc. Last but not least, prepared for different time periods, heatmaps may help to observe differences in customer behavior over a week or dayparts. Such information in turn can be used for proper staff management by focusing on proper actions and store parts.
Every technology has its limitations and predetermined conditions of use. Computer vision based methods are no different and one needs to be aware of the environmental dependencies of trained models. In case of store heatmap generation, the critical factor is the quality of the people detection algorithm. Poor detection quality impacts the final heatmap colors and may bias it in different ways, depending on the sort of detection mistakes. In particular, we can distinguish two types of detection errors: false positives, i.e. detections without the ground truth equivalent, and false negatives – when the person in the image is not recognized by the algorithm. The first type of error in a fixed camera view, when repeated on multiple frames, will accumulate to a (false) hot spot in the resulting heatmap.
On the other hand, lack of detections that results from false negatives, especially if correlated with a region of the camera view, will bias the color of this region towards cold. As a result, the information provided by the created heatmap is of little value and may lead to incorrect conclusions and actions.
Therefore, in order to get credible and actionable insights, one needs to make sure the model used for heatmap generation fits in the store environment and performs well. In some cases, additional model training and finetuning will be required, especially in stores with specific interior design, colors, lighting conditions etc. Another important aspect is the image source and the angle of the captured view. Typical people detection algorithms are trained on side views and may perform poorly on images acquired by top-down and fish eye view cameras. Hence one should pay attention to model preparation and training. In some cases the only way to get good quality results is to retrain the model with images and views taken at the given location. Then it is all up to the standards and criteria set up for annotation.

Merchandising is the process of promoting and selling products to customers. It involves the selection, presentation and pricing of products to encourage customers to make a purchase. Merchandising activities can take place in physical stores, online marketplaces and other sales channels. The goal of merchandising is to increase sales and revenue by providing customers with a positive shopping experience. Merchandising can involve a range of tasks, including product selection, display design, inventory management, pricing strategies, promotional campaigns and sales analysis.
Such solutions are already widely used in small area self-service stores, implemented and tested by many companies around the world, including the American Amazon or Polish chain of Żabka stores. The vision of stores of the future, where we make a purchase by walking through the shelves and choosing products we are interested in, is one of the biggest optimizations in this industry. Of course, an important aspect of such a shopping experience is having a number of necessary interfaces with the store, such as a mobile app, loyalty program and payment processing.
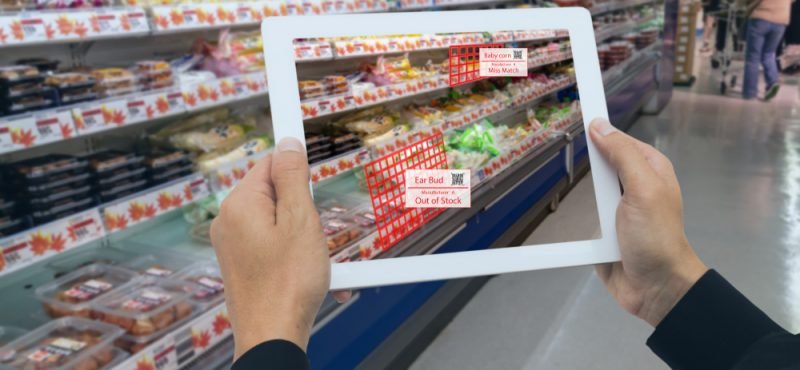
Taking above examples computer vision can be effective in supporting merchandising so that established goals can be achieved but also effectively monitored. Advanced algorithms can be trained based on photos or videos to recognize products, so that this can be used to automatically identify products in store. One of the most important tasks in merchandising is to analyze the condition of products on the shelves so that their optimal placement can be managed. Thanks to the advanced technology, this type of task can be carried out not only offline after the store is closed, but also in real-time mode, observing on the fly what choices customers make.

In summary, computer vision is a tool that, used in a proper way, can be an extremely useful tool in merchandising. Based only on the examples mentioned, we can save a lot of time and money and acquire a new source of data for advanced analysis of our processes, product sales and customer behavior. It is worth noting that spending on the infrastructure required to run such technology is nothing demanding today, most of the cameras and cloud services available on the market are quite sufficient.
Finally, let us mention how you should be prepared for the use of this type of technology. Of course, there is no way to do it without a good preparation of the dataset, and as we know, shopping fields are not the easiest environment, and we want to train algorithms on the basis of such data to be as precise as possible. Here it is worth first determining the boundary conditions, for example, whether we will use cameras or photos collected by employees? Since both observation angles, and data quality are important, we must not forget about the distance from the shelves. In other words, the area of the shelf that will be visible in one frame, so that the quality of detection and classification is satisfactory.
In the process of data annotation, we have to decide on one of the available methods, and here everything depends on the final scenario, whether we will use the bounding box method or semantic segmentation. To improve precision, the dataset must contain enough data with different arrangements of products: at different angles, on different fields, in larger or smaller clusters, with different lighting conditions. Appropriate questionnaire must be prepared for the test collection, which will be used to record ground truth, because in addition to the basic metrics of model performance, e.g. mAP, we also need to run tests properly on the production data. In this application, an interesting solution could be the use of the so-called Transfer Learning technique, which could speed up the subsequent “automatic” addition of new products, at the time of putting them on the shelves.
We use cookies to improve your experience on our site. By using our site, you consent to cookies.
Manage your cookie preferences below:
Essential cookies enable basic functions and are necessary for the proper function of the website.
These cookies are needed for adding comments on this website.
Statistics cookies collect information anonymously. This information helps us understand how visitors use our website.
Google Analytics is a powerful tool that tracks and analyzes website traffic for informed marketing decisions.
Service URL: policies.google.com (opens in a new window)
Clarity is a web analytics service that tracks and reports website traffic.
Service URL: clarity.microsoft.com (opens in a new window)
You can find more information in our Home and .